Experiment Report - ASCII Art Generation
Amit Bera
B2330056
Introduction
The objective of this experiment is to generate ASCII art from an image. ASCII art involves representing an image using ASCII characters, where different intensity levels of grayscale are mapped to specific characters. The experiment follows a structured approach, starting from image preprocessing to final ASCII conversion.
Methodology
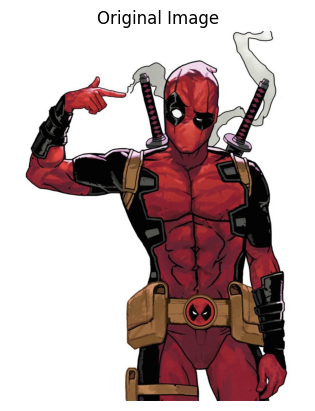
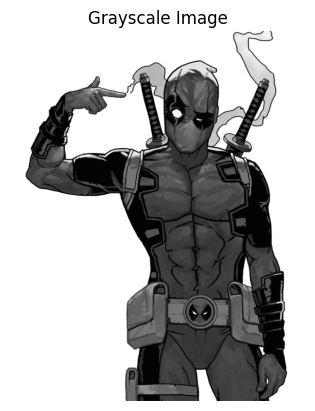
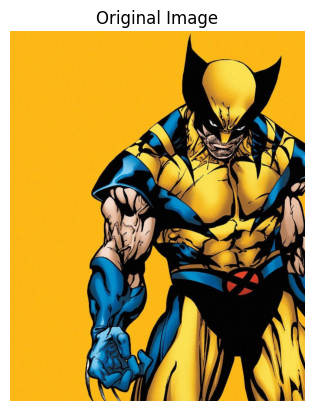
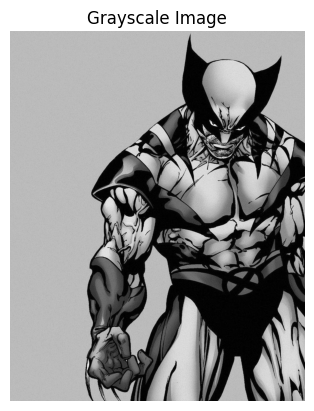
1. Read an Image & Conversion
The experiment begins by reading the input image and converting it to grayscale image. The grayscale image is used for further processing.
2. Resizing While Maintaining Aspect Ratio
The number of columns is set to 80, and the corresponding number of rows is computed using the original aspect ratio.
3. Grid Division for ASCII Mapping
The image is divided into a grid of tiles, where each tile corresponds to a block of pixels. The average intensity of each tile is calculated and mapped to an ASCII character based on predefined intensity levels.
4. ASCII Character Mapping
The average intensity of each tile is mapped to an ASCII character. Two sets of ASCII characters are used: one with 10 levels of intensity and another with 70 levels of intensity. The resulting ASCII art is saved as both text files and images.
Results
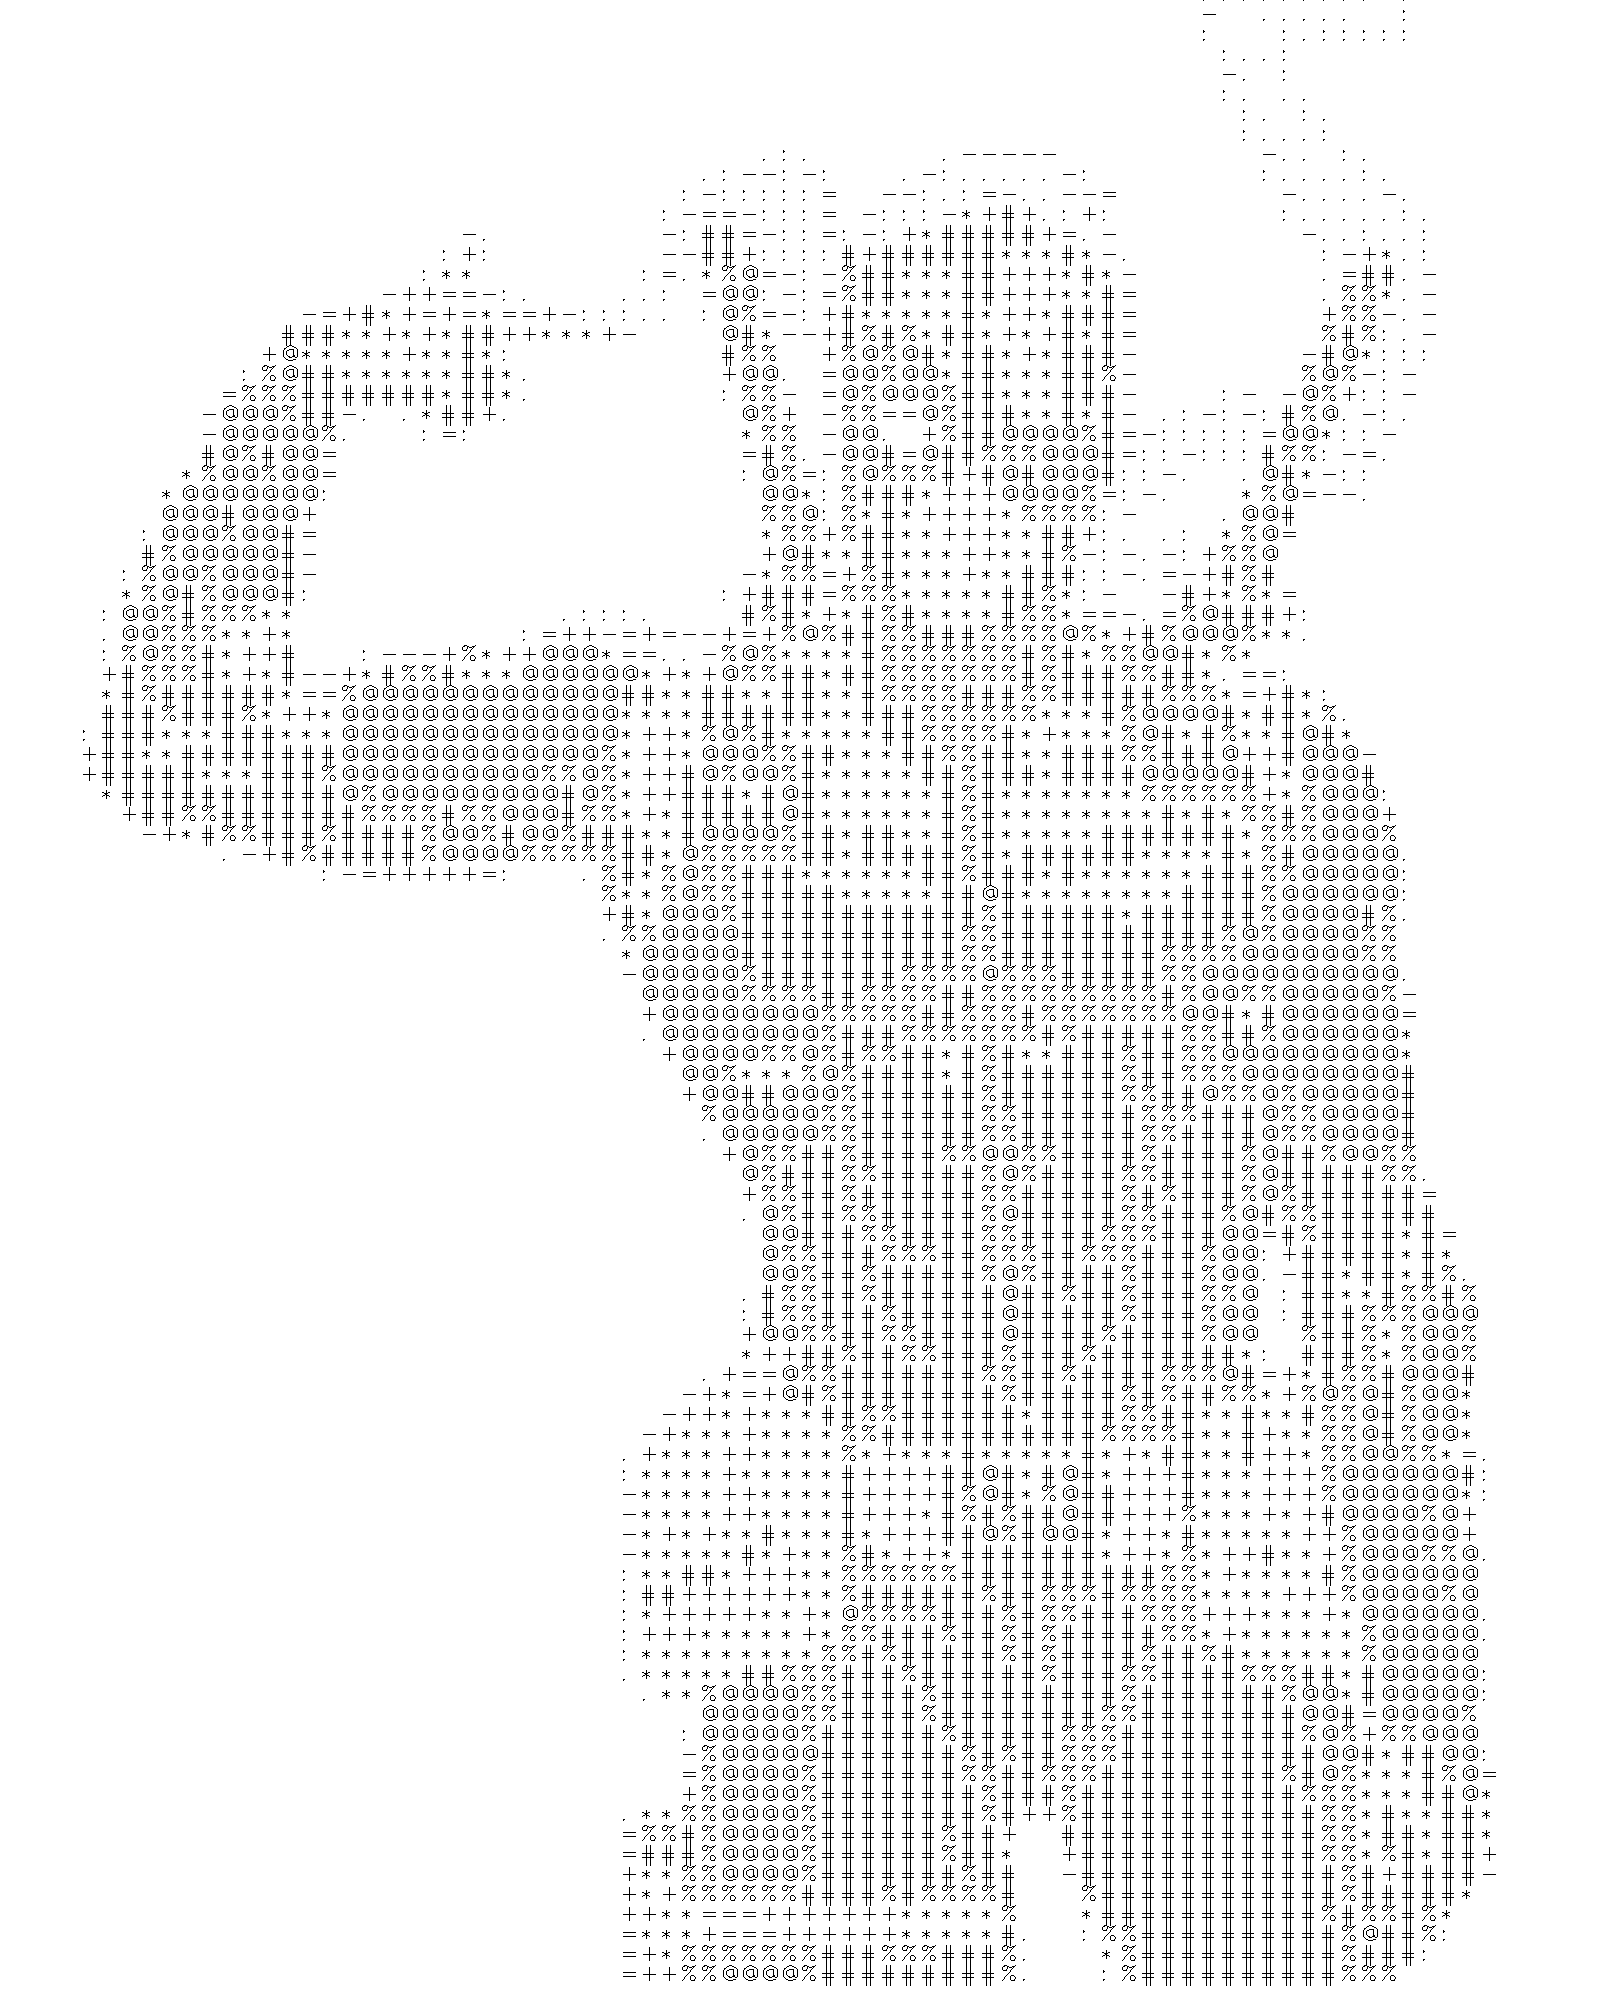
1. ASCII Art with 10 Levels of Intensity
The ASCII art generated using 10 levels of intensity is saved as a text file and an image. The characters used are: "@%#*+=-:. ".
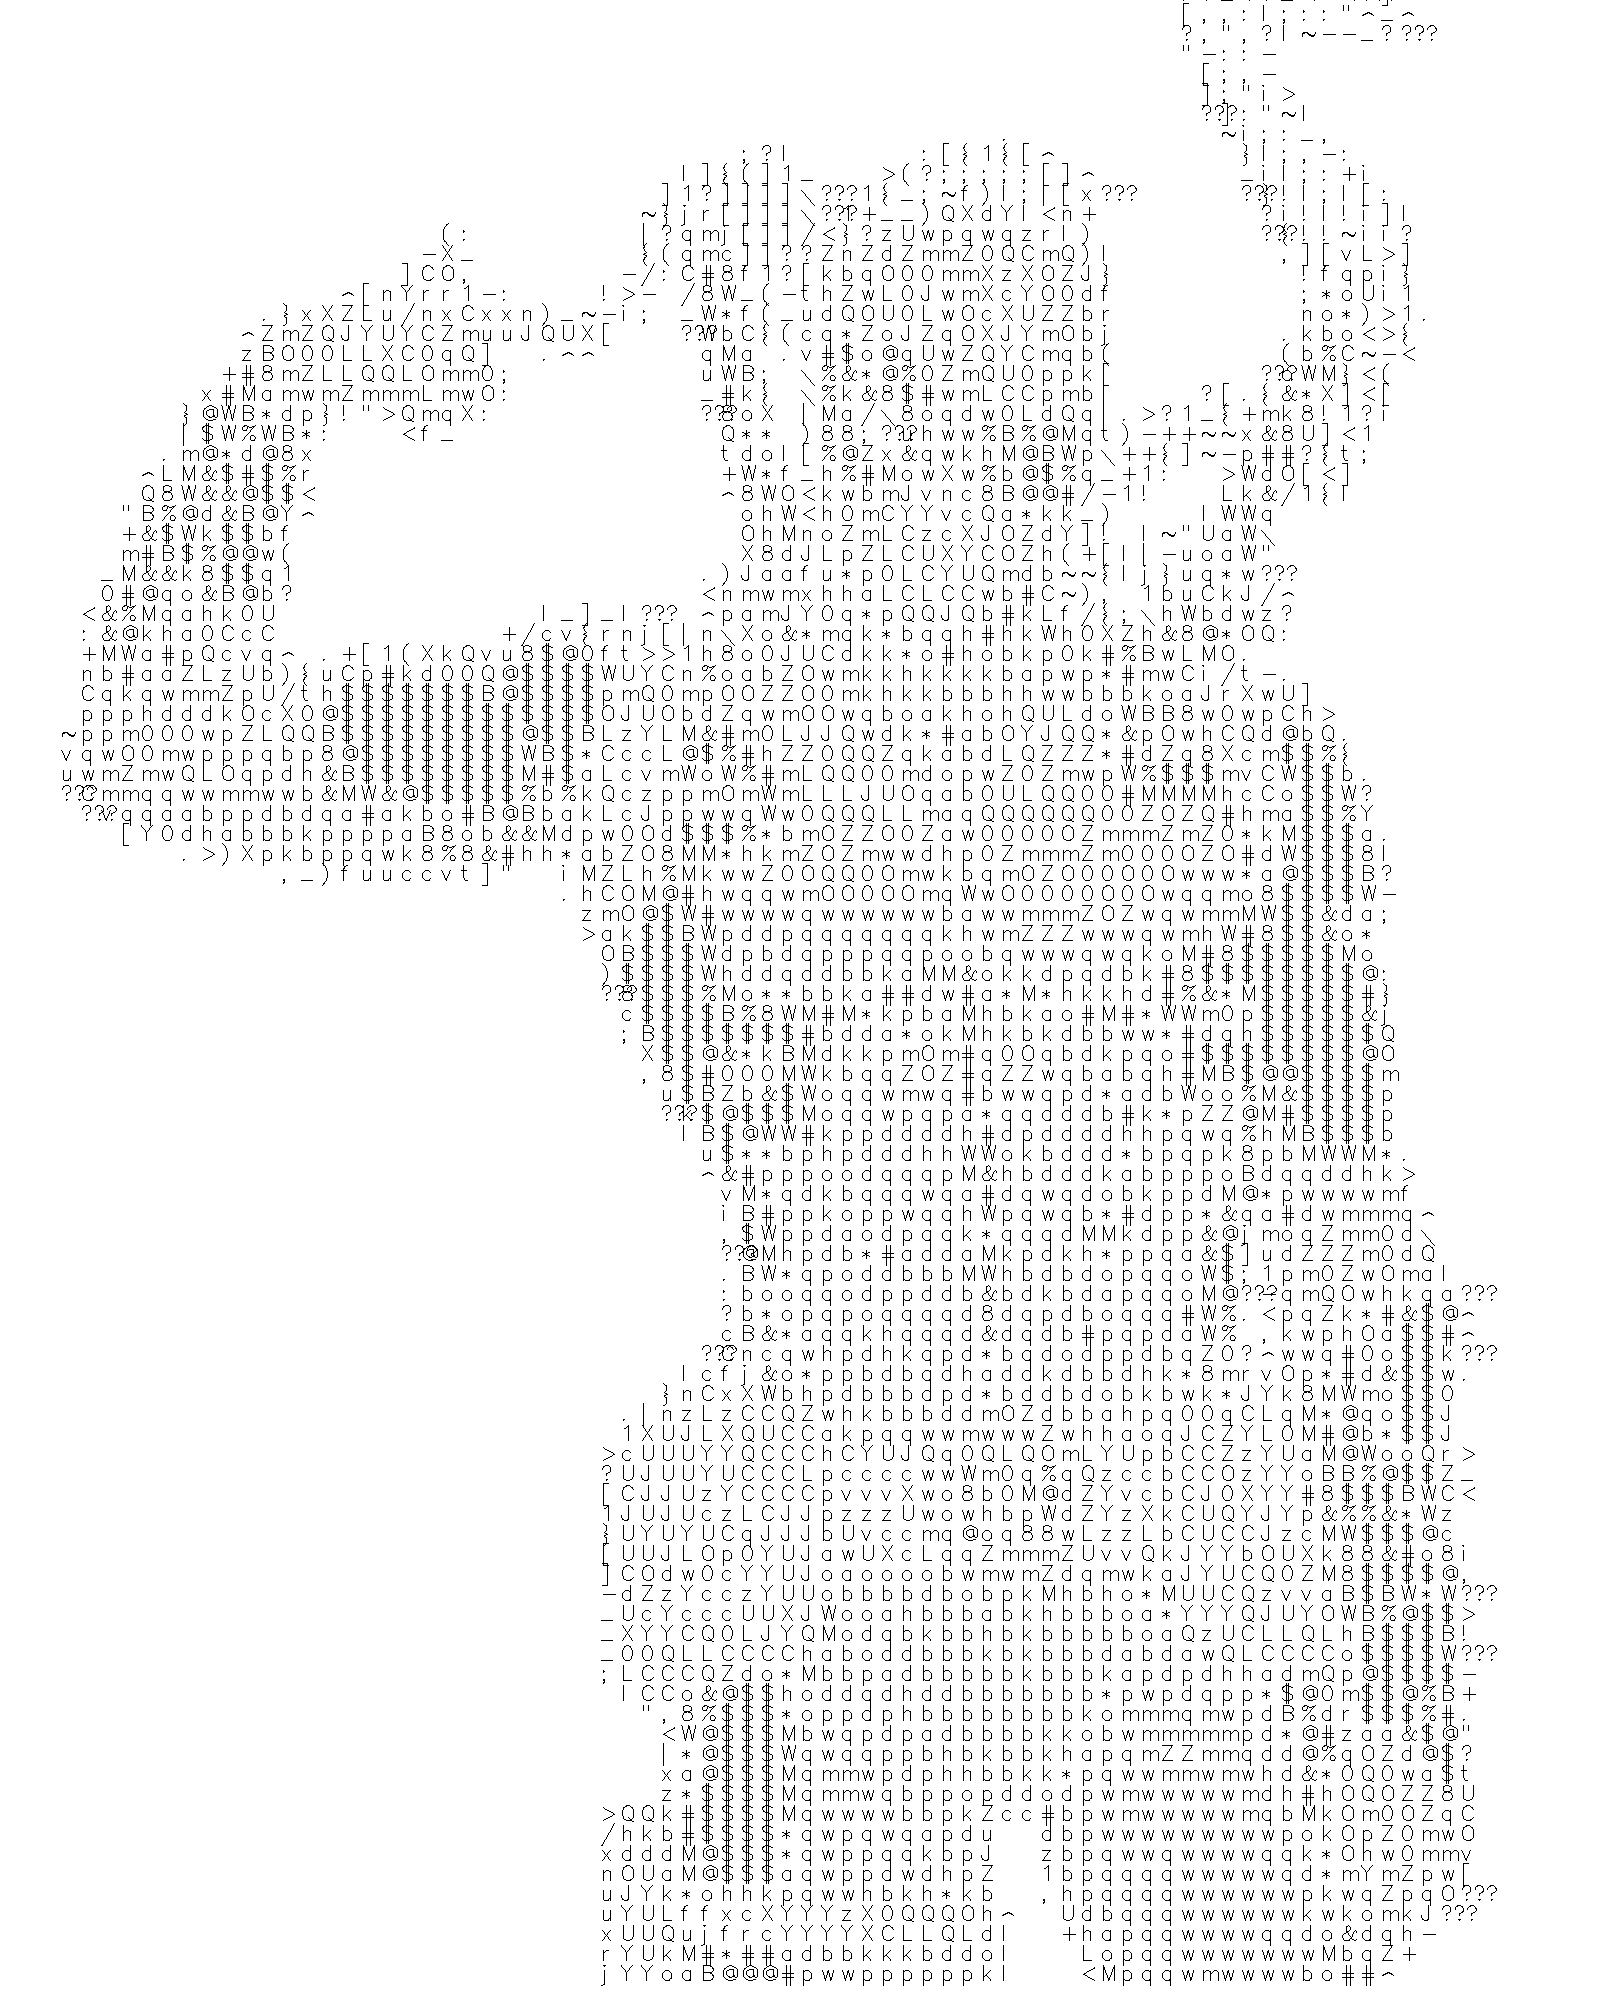
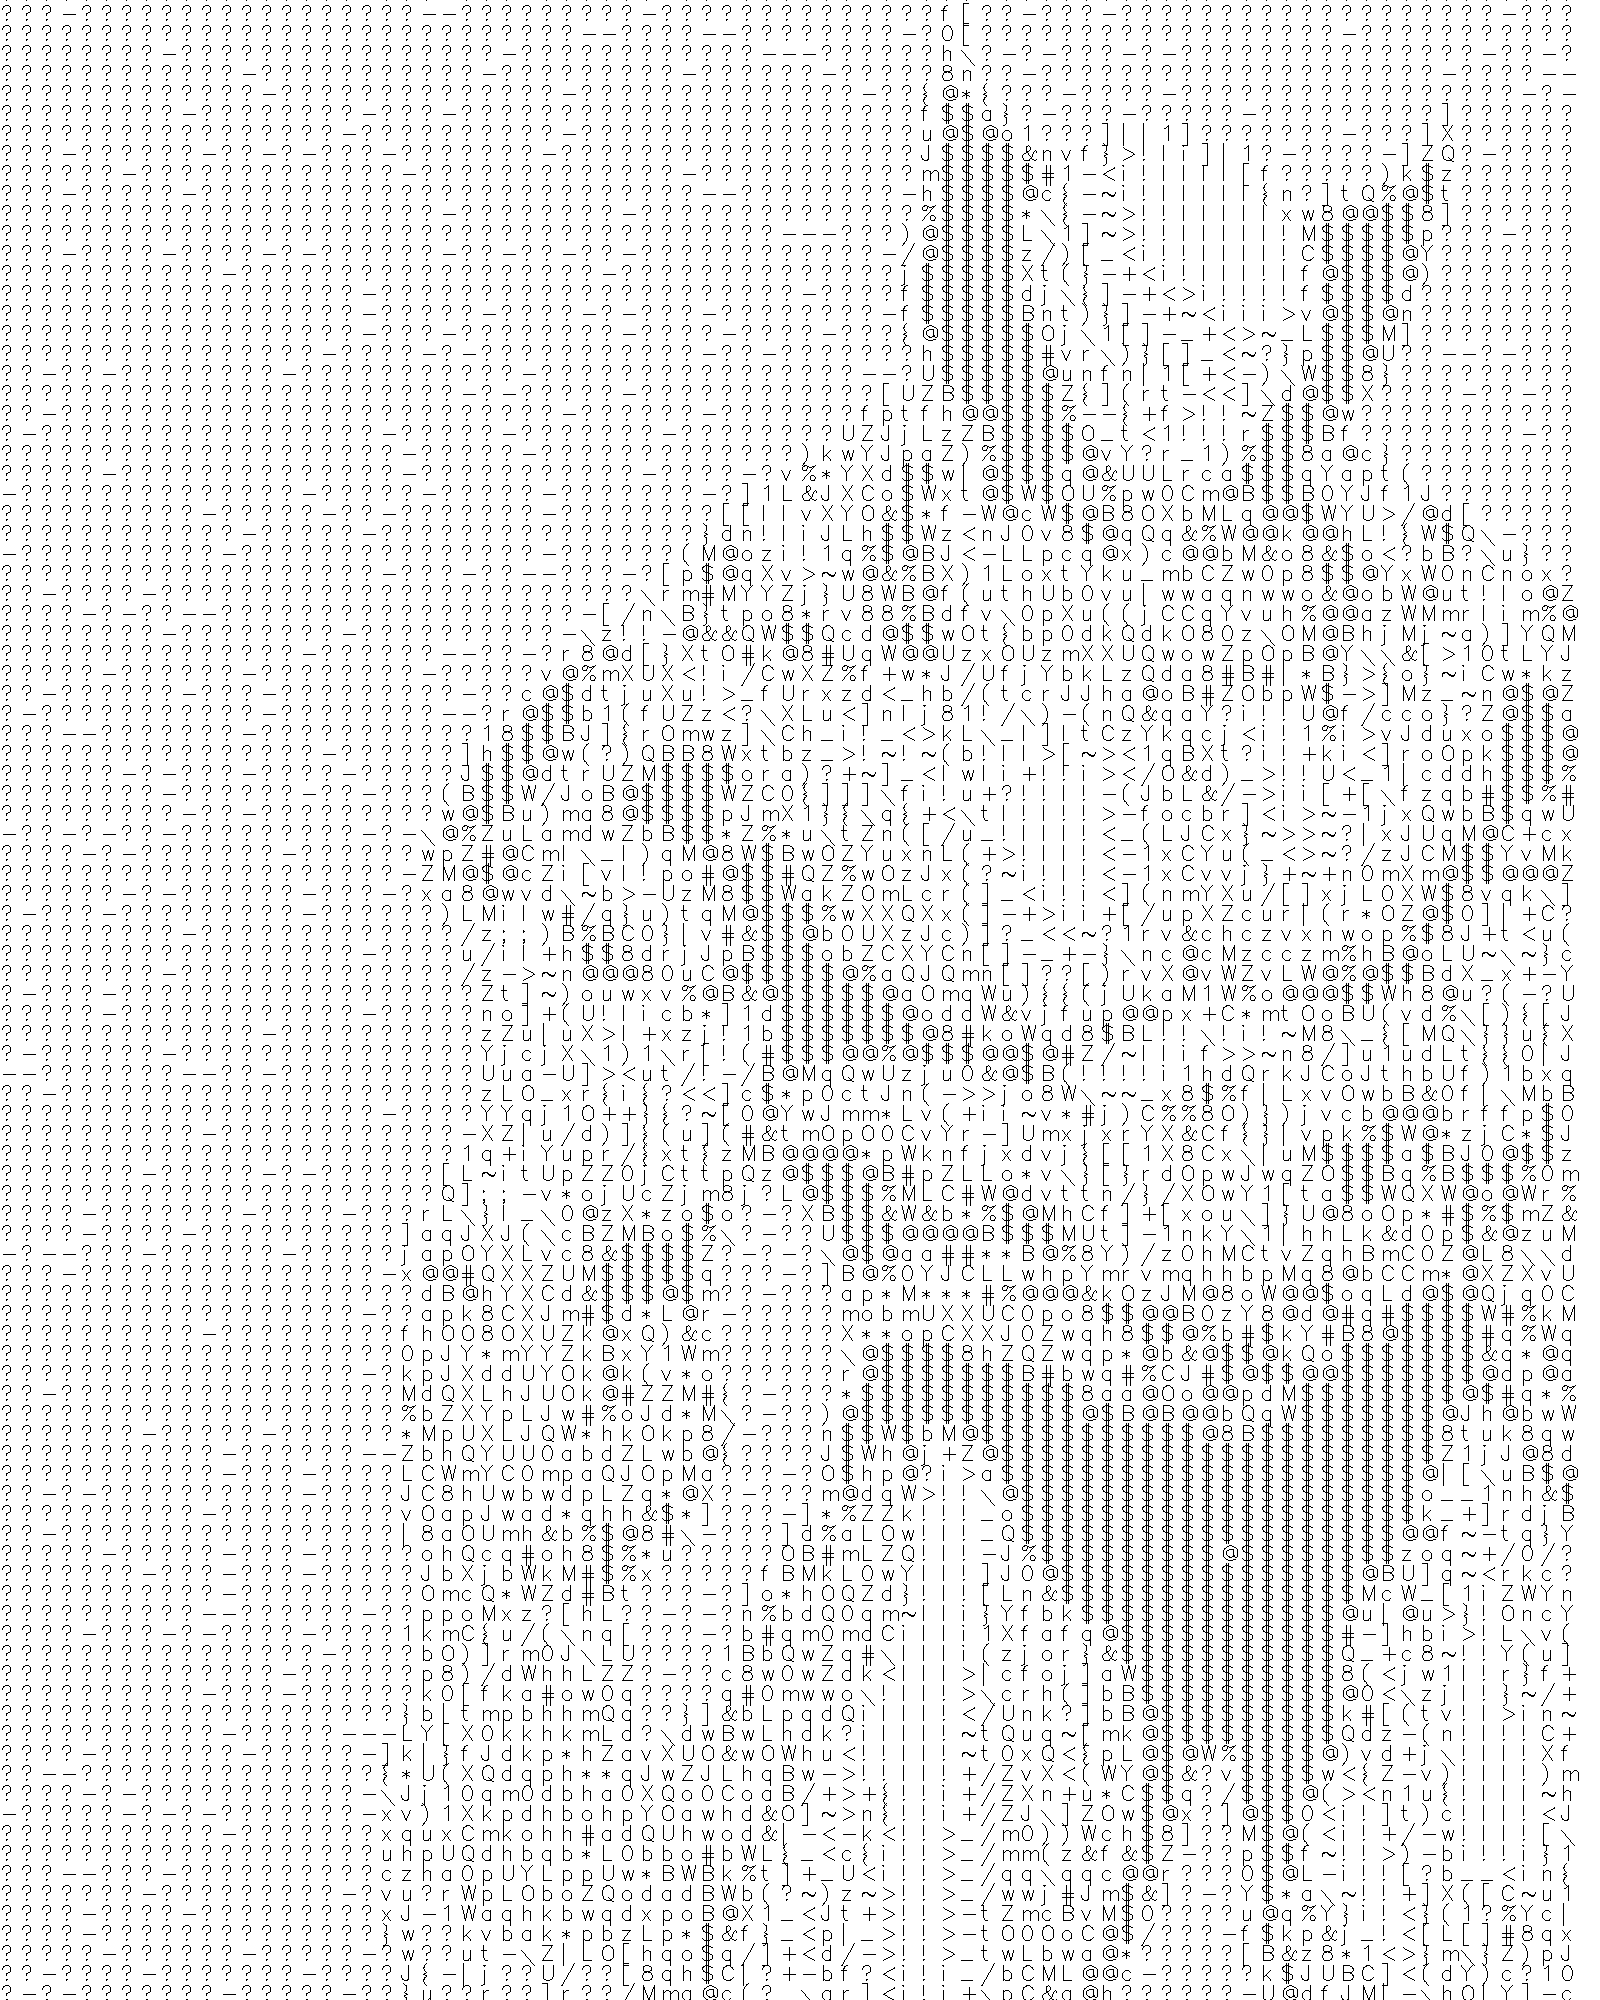
2. ASCII Art with 70 Levels of Intensity
The ASCII art generated using 70 levels of intensity is saved as a text file and an image. The characters used are: "$@B%8&WM#*oahkbdpqwmZO0QLCJUYXzcvunxrjft/\\|()1{}[]?-_+~<>i!lI;:,\"^‘’. ".
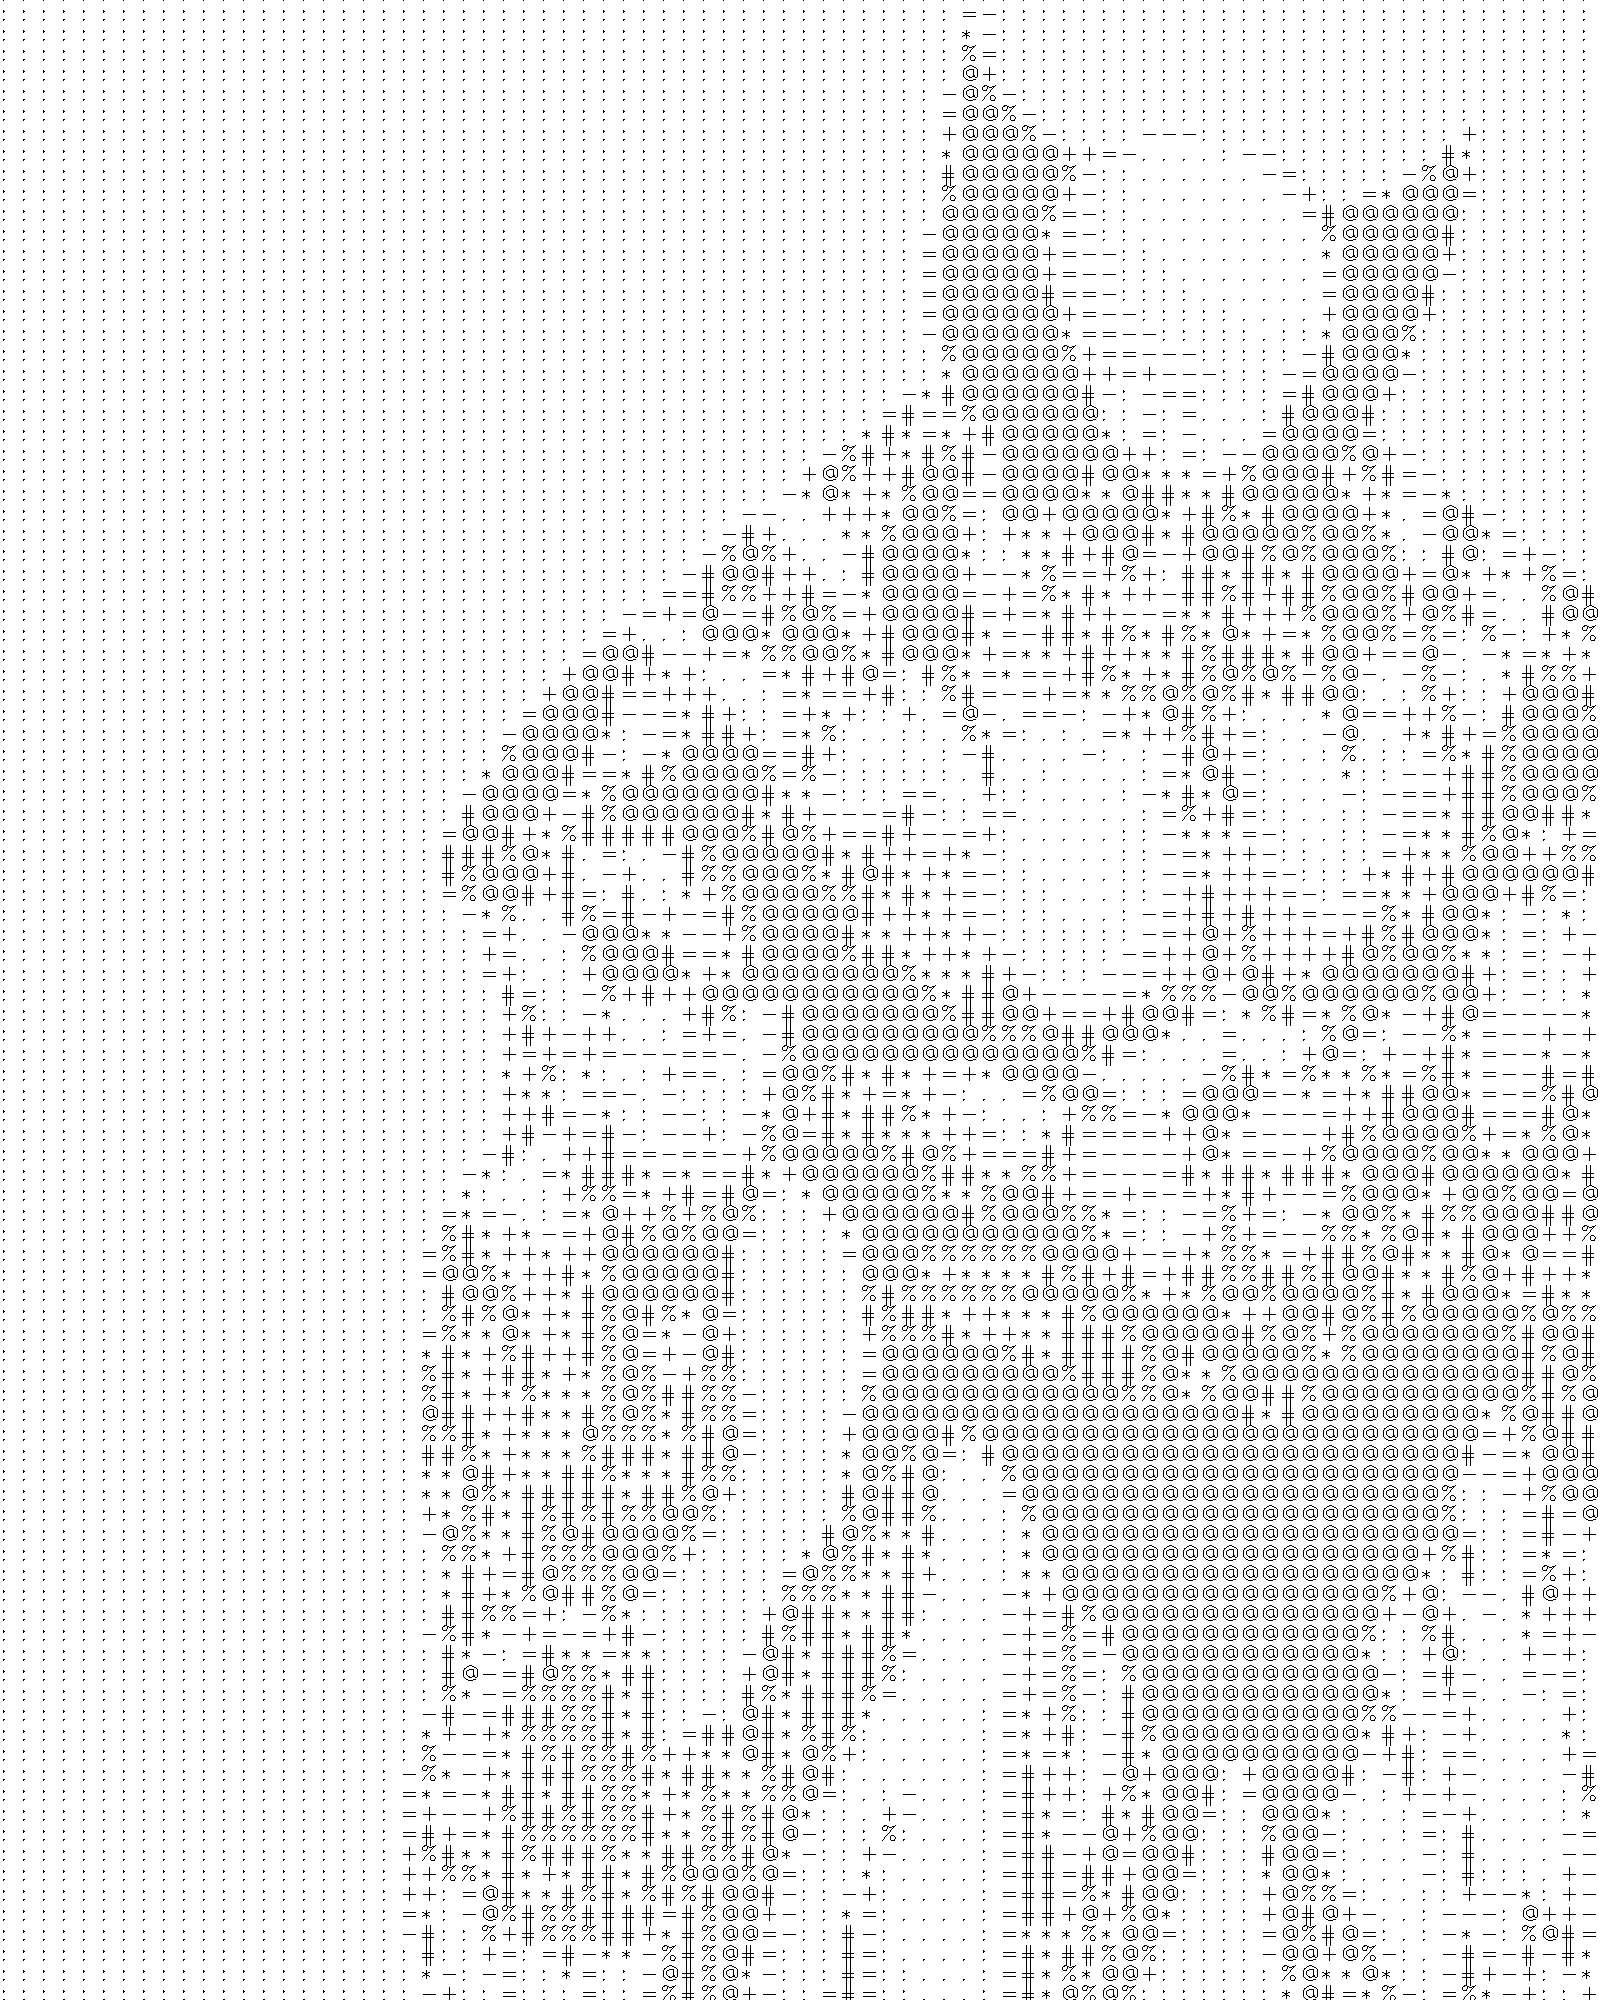
3. PCA-based ASCII Art Generation
PCA (Principal Component Analysis) is applied to the image to generate ASCII art. The PCA results are saved as CSV files for different values of k (3, 5, 7). The ASCII art is generated based on the PCA results and saved as text files and images.


4. Movie ASCII Art Generator
The ASCII art is generated based on the 10 levels and 70 levels of intensity results and saved as images then all together converted to video.
Conclusion
The experiment successfully generated ASCII art from an image using different methods. The results demonstrate the effectiveness of using different levels of intensity and PCA for ASCII art generation. The generated ASCII art can be used for various applications, including artistic representations and data visualization.